

 Russian


Спецификации Seagate FireCuda 540
| 2 ТБ | 1 ТБ | |
| Стандартная модель | ZP2000GM30004 | ZP1000GM30004 |
| Интерфейс | PCIe Gen5 ×4 NVMe 2.0 | PCIe Gen5 ×4 NVMe 2.0 |
| Флеш-память NAND | 3D TLC | 3D TLC |
| Форма фактора | M.2 2280-D2 | M.2 2280-D2 |
| Производительность | ||
| Последовательное чтение (максимум, МБ/с), 1 МБ | 10,000 | 9,500 |
| Последовательная запись (максимум, МБ/с), 1 МБ | 10,000 | 8,500 |
| Случайное чтение (Max, IOPS), 4KB QD32 T8 | 1,490,000 | 1,300,000 |
| Случайная запись (Max, IOPS), 4KB QD32 T8 | 1,500,000 | 1,500,000 |
| Выносливость/Надежность | ||
| Общее количество записанных байтов (TB) | 2,000 | 1,000 |
| Среднее время между сбоями (MTBF, часы) | 1,800,000 часов | 1,800,000 часов |
| Услуги по восстановлению спасательных данных (годы) | 3 | 3 |
| Гарантия, ограниченная (годы) | 5 | 5 |
| Управление энергией | ||
| Активная мощность, средняя (W) | 11 | 10 |
| Мощность в холодном режиме PS3, средняя (мВт) | 144 | 144 |
| Экологические | ||
| Температура, внутренний рабочий режим (°C) | 0°C ∼ 70°C | 0°C ∼ 70°C |
| Температура, неработающая (°C) | -40°С ≈ 85°С | -40°С ≈ 85°С |
| Удар, недействующий: 0,5 мс (Г) | 1500 Г | 1500 Г |
| Особые особенности | ||
| TRIM | Да, да. | Да, да. |
| С.М.А.Р.Т | Да, да. | Да, да. |
| SED TCG Opal 2.01 | Да, да. | Да, да. |
| Соответствие требованиям RoHS | Да, да. | Да, да. |
| Физические | ||
| Длина (мм/дюйм, максимум) | 80.15 мм/3.155 дюйма | 80.15 мм/3.155 дюйма |
| Ширина (мм/дюйм, максимум) | 22.15 мм/0.872 дюйма | 22.15 мм/0.872 дюйма |
| Высота (мм/дюйм, максимум) | 3.58 мм/0.140 дюйма | 3.58 мм/0.140 дюйма |
| Масса (г/фунт) | 7.4г/0.016фунтов | 7.4г/0.016фунтов |
Сигейт Файркуда 540
Для этого обзора мы тестируем 2ТБ Seagate Firecuda 540. Рядом с ним как сопоставимые есть смесь популярных Gen4 SSD, наряду с первой волной Gen5 SSD.Все модели Gen5 имеют ту же платформу Phison E26 и Firecuda 540..
- Samsung 990 Pro
- Сигейт Файркуда 530
- WD SN850X
- Гигабайт Aorus 10000
- Солидигм P44 Pro
Для тестирования мы используем две платформы.который иногда используется для более легких потребителей на основе тестов, таких как BlackMagic DiskSpeed Test и CrystalDiskMarkНаша основная платформа, однако, которая перекрывается с нашими корпоративными тестами, это Dell PowerEdge R760.который снабдил нас 8-х баком PCIe Gen5 JBOF для U.2/U.3М.2Это позволяет нам тестировать все текущие и новые типы приводов на одном и том же аппаратном обеспечении.
Конфигурация Dell PowerEdge R760
- Dual Intel Xeon Gold 6430 (32 ядра/64 потока, 1,9 ГГц базы)
- 1 ТБ оперативной памяти DDR5
- Убунту 22.04
Анализ рабочей нагрузки VDBench
При сравнении устройств хранения, тестирование приложений лучше всего, а синтетическое тестирование - на втором месте.синтетические тесты помогают базовым устройствам хранения с коэффициентом повторяемости, который позволяет легко сравнивать конкурирующие решенияЭти рабочие нагрузки предлагают широкий спектр профилей тестирования, начиная от тестов "четырех углов", общих тестов размеров передачи баз данных и заканчивая отслеживанием захвата из различных сред VDI.
Эти тесты используют общий генератор рабочей нагрузки vdBench с скриптовым двигателем для автоматизации и захвата результатов через большой компьютерный тест-кластер.Это позволяет нам повторять одни и те же нагрузки на различных устройствах храненияНаш процесс тестирования для этих показателей заполняет всю поверхность диска данными,затем разделы раздел диска, равный 1% от емкости диска, чтобы смоделировать, как диск может реагировать на рабочие нагрузки приложенияЭто отличается от полных тестов энтропии, которые используют 100% диска и приводят их в устойчивое состояние.
Для тестирования мы используем две платформы.который иногда используется для более легких потребителей на основе тестов, таких как BlackMagic DiskSpeed Test и CrystalDiskMarkНаша основная платформа, однако, которая перекрывается с нашими корпоративными тестами, это Dell PowerEdge R760.который снабдил нас 8-х баком PCIe Gen5 JBOF для U.2/U.3М.2Это позволяет нам тестировать все текущие и новые типы приводов на одном и том же аппаратном обеспечении.
Конфигурация Dell PowerEdge R760
- Dual Intel Xeon Gold 6430 (32 ядра/64 потока, 1,9 ГГц базы)
- 1 ТБ оперативной памяти DDR5
- Убунту 22.04
Профили:
- 4K случайный чтение: 100% чтение, 128 потоков, 0-120% iorate
- 4K Random Write: 100% Write, 64 потока, 0-120% iorate
- 64K последовательное чтение: 100% чтение, 16 потоков, 0-120% иората
- 64K Sequential Write: 100% Write, 8 потоков, 0-120% iorate
- Профили VDI
Начиная с случайного чтения 4K, SSD FireCuda 540 Gen5 показал лучшие результаты, достигнув пика 989K IOPS при 128.6μs в задержке, отставая только от Solidigm P44 Pro.
FireCuda 540 не справился в 4K случайных записях, однако, здесь он закончил тест третьим после последнего с только 251K IOPS с задержкой 98.7μs.Самый высокопроизводительный Samsung 990 Pro 2TB достиг пика в 573K IOPS.
Как и ожидалось, FireCuda 540 работал лучше при переключении на последовательные зачитывания рабочей нагрузки 64K (заметно лучше, чем диск Aorus 10000 Gen5).93 ГБ/с с задержкой 2870,8 мкм.
В последовательных записях FireCuda 540 снова упал в нижнюю часть таблицы лидеров, достигнув максимума всего 1,28 ГБ/с (или 21 КБ IOPS) с задержкой 773,6 мкм.
Затем мы посмотрели на наши VDI-бейнчмарки, предназначенные для дальнейшего обложения дисков. Эти тесты включают Boot, Initial Login и Monday Login.Результаты были все еще в районе верхнего уровня скорости Gen4 уровняНачиная с Boot, FireCuda 540 достиг максимума в 200K IOPS (при 162.6μs), прежде чем получить небольшой всплеск производительности в конце.
Для VDI Initial Login FireCuda 540 завершил тест на 59K IOPS (на 503,4μs).
Наконец, эталон VDI Monday Login, где FireCuda 540 был самым производительным и стабильным SSD.
Тест скорости диска Blackmagic
Мы измерили производительность в среде Windows 11 на нашей потребительской тестовой платформе с помощью популярного теста Blackmagic.В то время как чтение было немного более скромным в 6.74 ГБ/с.
Проверка скорости CrystalDiskMark
Мы провели легкое испытание на Seagate FireCuda 540 чтобы продемонстрировать его скорость Gen5.мы наблюдали последовательные скорости передачи, превышающие 10 ГБ/с для операций чтения и записиДля случайной 4K производительности диск достиг 1,0 млн IOPS для чтения и 1,01 млн IOPS для записи.Большая глубина очереди CrystalDiskMark (по сравнению с BlackMagic) позволяет нам продемонстрировать лучший сценарий для диска.
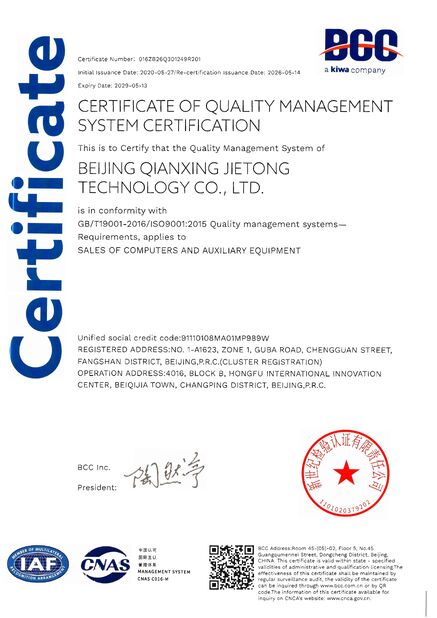
Сэнди Янг, директор по глобальной стратегии
WhatsApp / WeChat: +86 13426366826
Электронная почта: yangyd@qianxingdata.com
Сайт: www.qianxingdata.com/www.storagesserver.com
Бизнес фокус:
Распространение ИКТ-продуктов/интеграция систем и услуги/решения инфраструктуры
Имея более 20-летний опыт распространения ИТ, мы сотрудничаем с ведущими мировыми брендами для предоставления надежных продуктов и профессиональных услуг.
Использование технологий для создания интеллектуального мира Ваш надежный поставщик услуг ИКТ-продуктов!